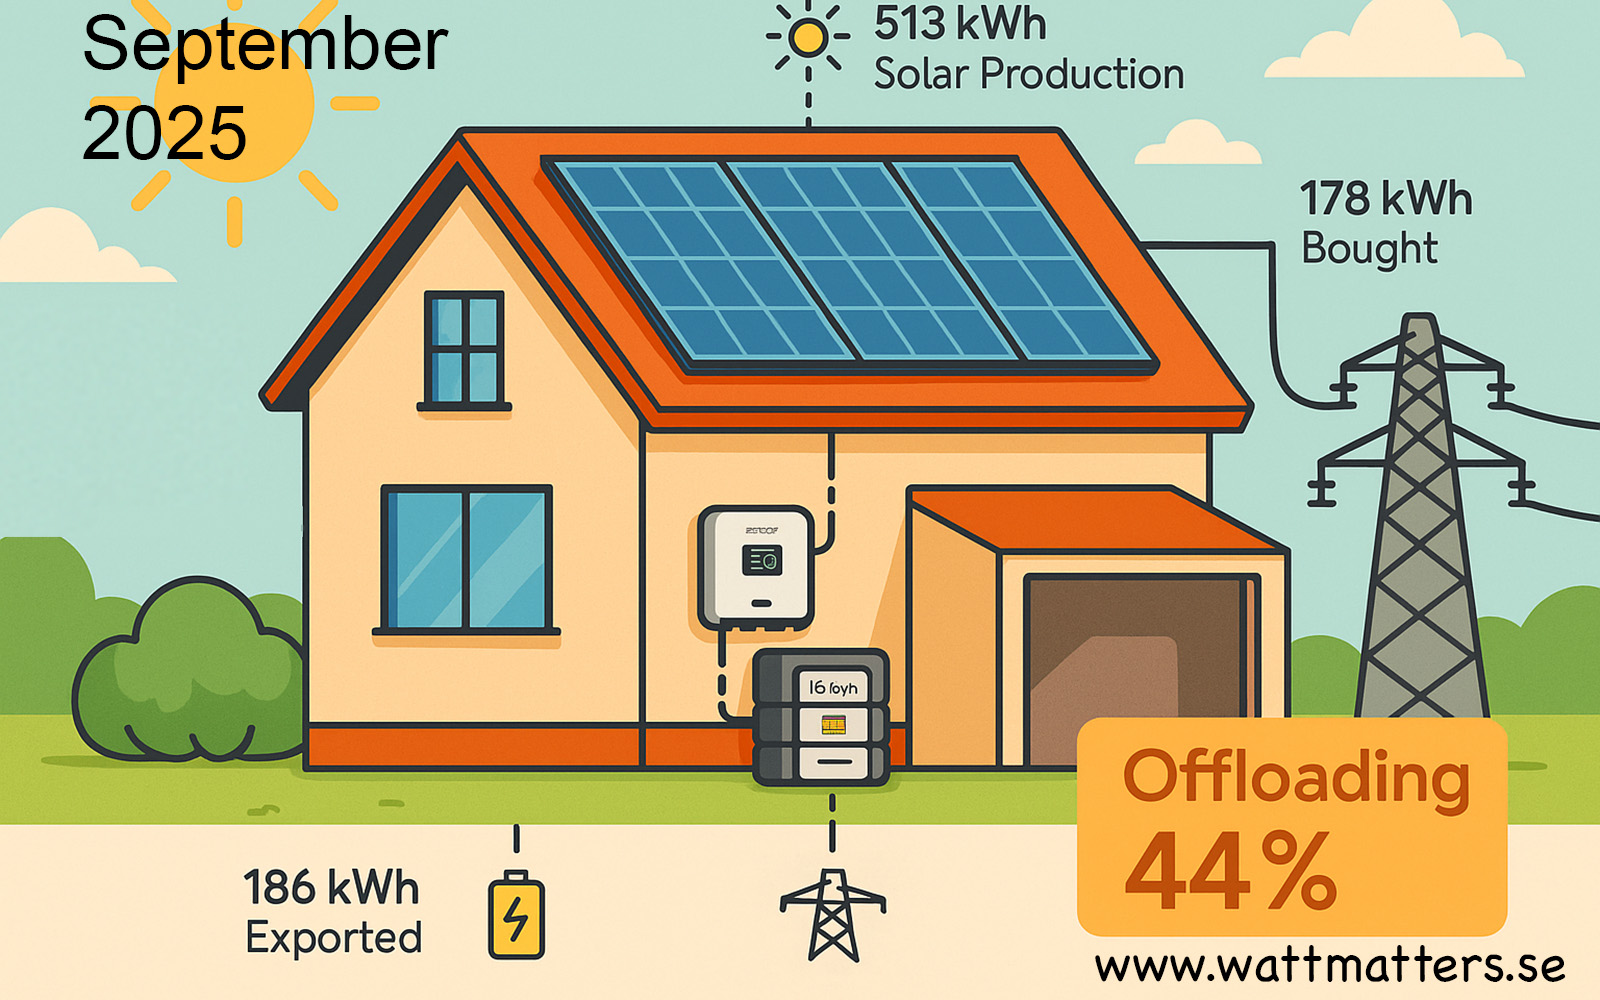
September marked the real start of autumn. Shorter days and a lower sun angle brought solar production down to 513 kWh, compared to 784 kWh in August.
Our setup consists of 20 solar panels (460 W each, 9 kW total) and a 16 kWh battery system (2 × 8 kWh) paired with a Sigenergy hybrid inverter. This combination allows us to both store our self-produced electricity and optimize energy use hour by hour – something that became especially noticeable this month.
Despite less sunshine, the system continued to perform well. Our routines for automation and battery management made a clear difference in how we both used and paid for electricity.
Production and Consumption
September showed a clear shift in both daylight and energy behavior.
Even with fewer sunny hours, our system delivered stable performance, and the battery played a key role in balancing usage throughout the day.
It was charged mainly from solar during daytime, and in the mornings and evenings it covered a large share of our household needs.
When the battery wasn’t full (below 90 %), we also charged it at night during the lowest price hours – using cheap grid electricity to reduce expensive purchases later in the day.
The result was high self-consumption and minimal need to buy electricity from the grid.
| Key data | September (kWh) | Comment |
|---|---|---|
| Solar production | 513 | Total solar energy produced |
| – Solar → household (direct) | 170.9 | Used directly in the house |
| – Solar → battery (storage) | 256.0 | Stored for later use |
| – Solar → grid (export) | 86.1 | Sent to grid when production exceeded demand |
| Battery (discharge) | 367.0 | Energy released from storage |
| – Battery → household | 290.0 | Used in the home (mainly morning and evening) |
| – Battery → grid | 77.0 | Exported stored solar energy |
| Electricity bought | 178.0 | Imported from the grid |
| Electricity sold | 164.0 | Combination of direct solar (86 kWh) and stored battery energy (77 kWh) |
Key Figures
| Metric | Result | Comment |
|---|---|---|
| Self-consumption | 83 % | Solar energy used locally or stored |
| Self-sufficiency | 66 % | Share of total consumption covered by own production |
| Battery contribution | 55 % | Share of total consumption supplied by the battery |
| Offloading factor | 44 % | Reduction of average price paid vs. market average |
Prices and Market
| Value | September | Comment |
|---|---|---|
| Average purchase price | 45.48 öre/kWh | Clearly below market average |
| Average selling price | 97.94 öre/kWh | Strong return for exported energy |
| Market average (SE3) | 81.34 öre/kWh | Typical morning and evening peaks |
Since we sold almost 164 kWh, we achieved a better price than the market average.
This was mainly because most of our exports happened during peak price hours.
It’s a bit of a balancing act though – to sell at the best time, you can’t fully discharge your battery, which sometimes means buying electricity later (plus grid fees).
Finding the right balance between self-consumption, stored reserve, and export timing is therefore a key part of optimization.
Offloading Factor – Shifting Use to the Right Time
In September, we introduced a new metric: the offloading factor, showing how effectively we shift electricity use to lower-priced hours through automation and storage.
The result was 44 %, meaning our average electricity cost was 44 % lower than the market average.
The battery was mainly charged during low-price night hours and discharged during morning and evening peaks – a strategy that clearly paid off.
This also serves as preparation for the upcoming power-based tariffs being introduced in Sweden from 2026, where cost will depend not only on how much you use – but also when you use it.
By already optimizing for timing today, we are preparing for a future where power control will matter just as much as total energy use.
Observations
- Solar production dropped from 784 kWh in August to 513 kWh in September, reflecting the seasonal transition.
- 83 % self-consumption means nearly all solar energy was used locally or stored.
- The battery covered 55 % of household demand and contributed to exports during high-price hours.
- Night-time charging at low prices helped improve the offloading factor and reduce grid purchases.
- 66 % self-sufficiency means two-thirds of our electricity came from our own production.
- The combination of solar, battery, and smart control provided a clear financial advantage compared to spot market prices.
Looking Ahead
October will bring shorter days and cooler mornings, likely increasing grid imports.
At the same time, it will open new opportunities to optimize through peak shaving and offloading as the winter season approaches.
No responses yet